Actuator
在现代微服务架构中,应用的运行时状态监控是保障系统稳定性与可观测性的核心环节。SpringBoot中的Actuator模块正是为此而生,通过Actuator模块,开发者可以轻松地暴露应用的运行健康状态、度量指标(Metrics)、环境信息、配置详情等,而无需编写大量样板代码。
引入Actuator依赖
在SpringBoot工程的pom.xml中添加以下依赖。
<dependency>
    <groupId>org.springframework.boot</groupId>
    <artifactId>spring-boot-starter-actuator</artifactId>
</dependency>
引入依赖后,应用启动时会自动配置一系列的管理端点(Endpoint)。默认情况下,出于安全考虑只有health端点是通过HTTP公开可访问的,其他端点(如metrics、info等)需要通过配置显式开启,有关这些配置我们将在后文详细介绍。
Endpoint开启和暴露
Endpoint的开启(enabled)和暴露(exposed)是两个概念,开启是指Endpoint是否被创建并注册到应用上下文中,默认情况下大多数Endpoint都是开启的(除了像shutdown这样的敏感端点);暴露则是指Endpoint能否通过特定协议(HTTP或JMX)访问,默认情况下所有开启的端点都能通过JMX访问,但仅有health端点能通过HTTP访问。下面表格展示了常用端点的默认开启和暴露状态。
| 端点 ID | 描述 | 默认开启 | 默认Web暴露 |
|---|---|---|---|
health |
显示应用程序的健康信息(UP/DOWN) | 是 | 是 |
info |
显示任意的应用信息(构建版本、Git信息等) | 是 | 否 |
metrics |
显示详细的度量指标(内存、CPU、HTTP请求统计等) | 是 | 否 |
loggers |
显示和修改应用程序的日志配置 | 是 | 否 |
env |
显示Spring的Environment中的属性来源 |
是 | 否 |
beans |
显示应用程序中所有Spring Bean的完整列表 | 是 | 否 |
threaddump |
执行线程转储 | 是 | 否 |
heapdump |
下载堆转储文件(HPROF格式),用于分析OOM等 | 是 | 否 |
sbom |
提供软件物料清单(Software Bill of Materials) | 是 | 否 |
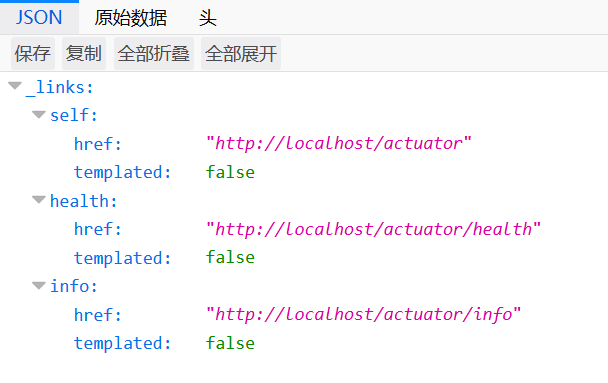
启动SpringBoot工程后,我们可以用浏览器访问/actuator,查看当前哪些Endpoint是Web暴露的。
开启一个Endpoint的Web暴露可以按如下设置,如果想暴露所有端点可以使用*通配符(不建议,这样做很危险)。
management.endpoints.web.exposure.include=health,info,metrics
如果你想彻底关闭所有Endpoint的Web暴露,可以使用如下配置。
management.endpoints.web.exposure.exclude=*
不过这样配置后你仍然可以访问/actuator,只不过里面显示没有Endpoint是Web暴露的,如果你想把/actuator也关了,可以如下这样配置。
management.server.port=-1
management.server.port可以配置Endpoint的Web暴露端口,默认情况下它和应用是同一个端口,如果将其设置为-1,那么就停止所有的Web暴露了。如果你想将Endpoint的Web暴露端口改为和应用端口不同的值,也可以配置该属性实现。
如果我们不想使用/actuator这个基础路径,它可以可以通过配置修改的。
management.endpoints.web.base-path=/monitor
健康状态端点
对于一个服务端应用,健康状态是最基础也是最重要的端点,它常用于负载均衡器的健康检查探针,这里我们详细了解一下。
health端点显示详细信息
默认情况下,health端点只返回简单的{"status": "UP"}。我们可以配置显示更详细的组件状态(如数据库、Redis、磁盘空间等)。
management.endpoint.health.show-details=always
其中,management.endpoint.health.show-details的默认值是never,如果配置成always则会展示详细信息。
Kubernetes健康检查探针支持
Actuator模块还对Kubernetes的Liveness Probe(存活探针)和Readiness Probe(就绪探针)有原生支持。添加以下配置开启Kubernetes健康检查探针支持。
management.endpoint.health.probes.enabled=true
开启后,Actuator会额外暴露对应Kubernetes的两个健康检查端点。
/actuator/health/liveness:检查应用程序是否正在运行且状态正常/actuator/health/readiness:检查应用程序是否已准备好接收流量
自定义端点
如果内置端点无法满足需求,我们可以基于@Endpoint注解开发自定义监控端点。
package com.gacfox.demo;

import org.springframework.boot.actuate.endpoint.annotation.Endpoint;
import org.springframework.boot.actuate.endpoint.annotation.ReadOperation;
import org.springframework.boot.actuate.endpoint.annotation.Selector;
import org.springframework.boot.actuate.endpoint.annotation.WriteOperation;
import org.springframework.stereotype.Component;

import java.util.Map;
import java.util.concurrent.ConcurrentHashMap;

@Component
@Endpoint(id = "custom-feature")
public class CustomFeatureEndpoint {
    private final Map<String, String> features = new ConcurrentHashMap<>();

    @ReadOperation
    public Map<String, String> features() {
        return features;
    }

    @ReadOperation
    public String feature(@Selector String name) {
        return features.get(name);
    }

    @WriteOperation
    public void configureFeature(@Selector String name, String value) {
        features.put(name, value);
    }
}
自定义端点通常提供三个方法,以上面为例:
Map<String, String> features():对应GET请求/actuator/custom-feature,表达查看信息String feature(@Selector String name):对应GET请求/actuator/custom-feature/{name},表达按一个Key名查看信息,@Selector参数会追加到路径段void configureFeature(@Selector String name, String value),对应POST请求/actuator/custom-feature/{name},可接收JSON数据{"value": ""},表达写入配置信息